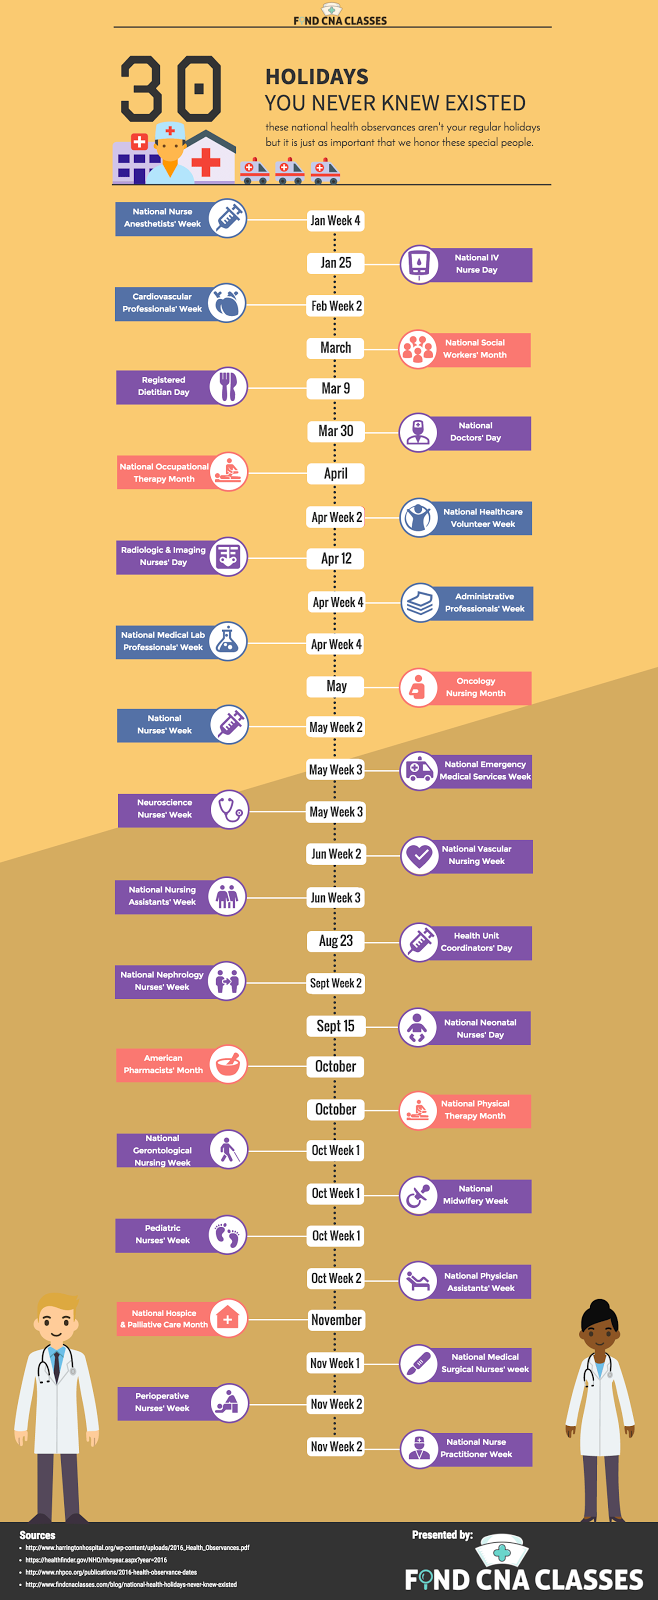
Holidays for Healthcare Professionals
Nov 16, 2016 4:13:00 PM / by user posted in nursing, guest post, infographic
Technology in Nursing - an infographic
Mar 23, 2016 2:27:00 PM / by user posted in nursing, infographic
This is a great example why technology in the classroom is so important!
Nurses are Essential to Delivering Cost Effective Care (an infographic)
Mar 14, 2016 2:18:00 PM / by user posted in nursing, infographic
We talk a lot about how EHRs can help improve the cost effectiveness of medical treatments. But what's one of the primary ways to cut costs? Turns out it revolves around nurses.
Hiring more nurses is crucial for things such as lowering patient mortality, and reducing number of days patients spend in hospitals and other cost-related items. As you can see, hospitals with lower patient-to-nurse ratios had total of 6,239 fewer infections, with an annual cost saving of up to $68 million. You can find out more by taking a look at the full infographic here:
February is American Heart Month! Check out this relevant infographic.
Feb 2, 2016 7:10:00 AM / by user posted in heart month, infographic
Heart Disease 101: in pictures
Nov 3, 2015 12:36:00 PM / by user posted in nursing education, free resources, health science education, infographic
Along with some of our past posts including infographics on different diseases, we found this great image from University of Florida.
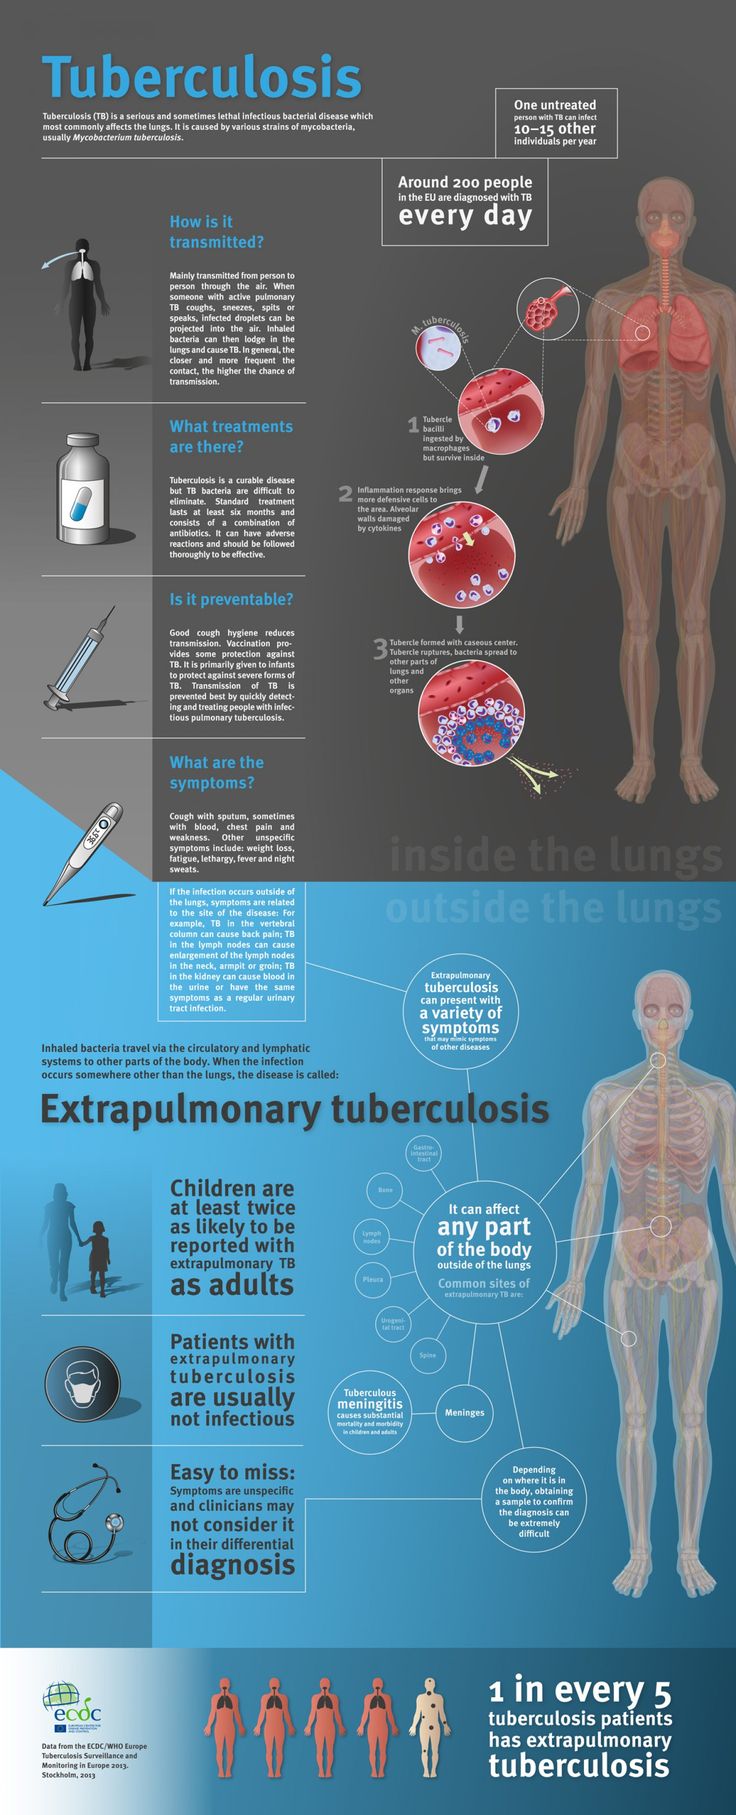
Infographic: Tuberculosis
Oct 27, 2015 12:34:00 PM / by user posted in nursing education, free resources, health science education, infographic
Here's another post in our series of infographics that gives the rundown on a nasty disease: Tuberculosis. This particular visual aid gives some basic information on the transmission and symptoms of the disease. This is great for anyone learning about different diseases or parents looking for more information before a TB shot.
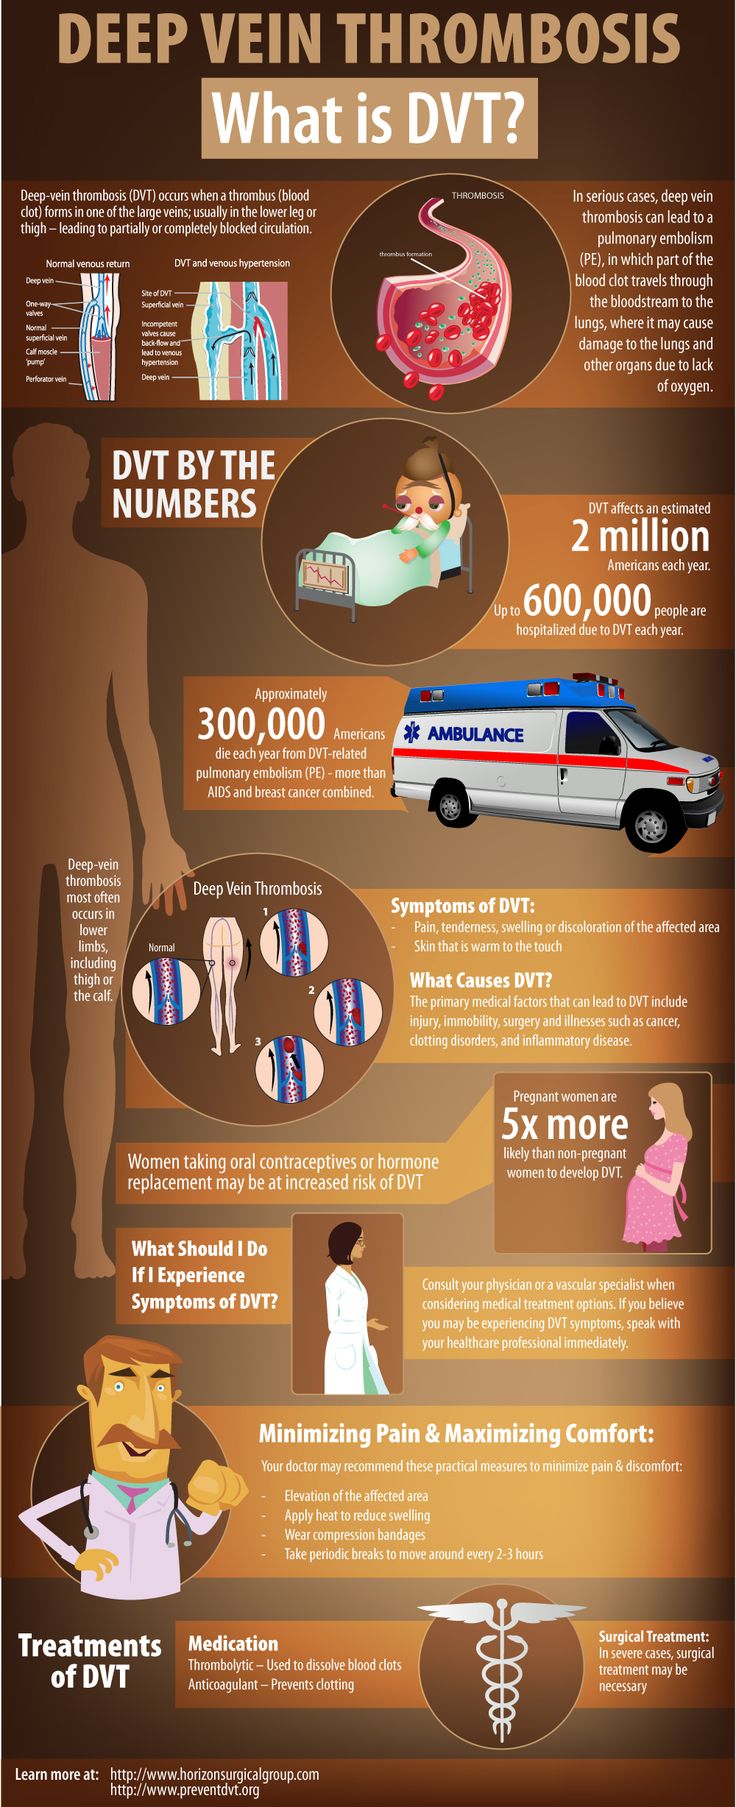
Visual Learning: DVT
Oct 20, 2015 12:28:00 PM / by user posted in nursing education, free resources, health science education, infographic
We've been stumbling across quite a few useful infographics lately, so we thought we'd keep up the trend. After finding some images related to specific diseases, we realized these might be useful for those of you who are visual learners. While you may have already listened to a lecture on these diseases, we thought this series of infographics might help solidify the information. These are also great for instructors who would like to provide more resources for students who need visual instruction.
Demographics of Disease and How it Can Effect Your Clinical Experience
Oct 13, 2015 10:35:00 AM / by user posted in nursing education, free resources, infographic, simulation, teaching idea
We found this fascinating infographic from University of Florida outlining the demographics of different diseases in the US. Examining this from a Nurse Education standpoint, we think it's fascinating how different regions may provide extremely different clinical experiences for students. For example, students in North Carolina, South Carolina and Georgia will probably work with more Heart Disease and Stroke patients than their northern counterparts. On the other hand, a student working in California facilities is more likely to encounter HIV/AIDS patients.
Know Your Drugs
Oct 6, 2015 10:22:00 AM / by user posted in free resources, infographic, pharmacology
University of Florida came up with this great infographic to help patients learn more about the medications they may be prescribed. However, I thought this was a great resource for Nursing students learning about various drugs. It isn't very comprehensive, but it does give you a look at some of the basic meds, their doses and the process manufacturer's go through to get approval for new medications.


